|
This year is the 60th anniversary of the landmark Supreme Court ruling, Brown v Board of Education, that desegregated American public schools. To mark this anniversary, Americans are reflecting on the progress that has been made for Black students since that time. This anniversary has also focused attention on the Teacher Diversity Gap and the need for more teachers of colour. This year is also the 50th anniversary of a similar milestone in Ontario. In 1964, Leonard Braithwaite, Ontario's first Black MPP, led the removal of the repeal of the 114-year-old provision of the Separate Schools Act that allowed for segregated schools for students of colour. Unfortunately this milestone has gone largely unnoticed in Ontario. Student and parent concerns about the Teacher Diversity Gap are raised occasionally throughout Ontario. These issues were raised in the wake of the shooting death of Abshir Hassan, a supply teacher with the Toronto District School Board. News reports quote administrators, students and parents calling Hassan a "good" man and "beloved" teacher who was able to connect with students in the priority neighbourhood in which he worked largely because he was from the community and of the same ethno-racial background as many of the students. Students noted that he was committed to their success and understood the challenges they face growing up Black and Somalian in Toronto. The provincial government's 2009 Equity and Inclusive Education policy recognizes the need for greater diversity among teachers. It requires that school boards "implement positive employment practices that support equitable hiring, mentoring, retention, promotion, and succession planning." However, while the policy notes that board staff "should reflect the diversity within the community," there is no requirement that boards collect data, analyze the diversity gap or implement efforts to close the gap. So, how well are Ontario schools doing to reflect the increasing diversity of the student population? And how do we compare to the United States? To gauge how well Ontario is doing, we've calculated the Teacher Diversity Gap for Ontario, Toronto CMA, and compared it to the gap in the United States and a number of states. The Teacher Diversity Gap is the comparison of the percentage of teachers of colour to the percent of students of colour. A value of 1.0 indicates that there is no gap and that the diversity among the teaching population reflects the diversity among the student population. The smaller the number, the more significant the gap. The challenge in conducting this analysis is that while data is readily available for the United States, the same data is not readily available in Canada. For the United States, teacher and student demographics are available by state and race. We have used this data to calculate the Teacher Diversity Gap for a number of states. While there is data on the number of teachers in Ontario and Toronto CMA, the figures includes all teachers, including those working in private schools. The data on the number of students of colour isn't readily available, so the proportion of racial minorities in the total population is used instead. The chart below shows the Teacher Diversity Gap for Ontario and Toronto CMA and compares it to the gap for the United States and specific states. 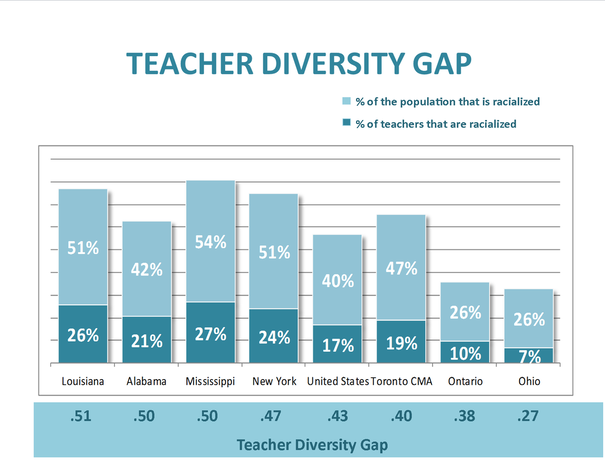 The data shows that:
There are many reasons to close the Teacher Diversity Gap and a lot of evidence that shows that students of colour do better with teachers of colour. There are also many policy options to close the demographic divide that exists in Ontario schools. Given the benefits of closing the Teacher Diversity Gap and the various options for addressing the issue, why isn't the province and the school boards doing more to bring teachers of colour into the classroom? Data Sources: Workforce Population Showing Representation by Employment Equity Occupational Groups and Unit Groups (2006 NOC) for Women, Aboriginal Peoples and Visible Minorities - Toronto CMA Labour Program, Human Resources and Skills Development Canada Workforce Population Showing Representation by Employment Equity Occupational Groups and Unit Groups (2006 NOC) for Women, Aboriginal Peoples and Visible Minorities - Ontario Labour Program, Human Resources and Skills Development Canada 2011 National Household Survey Highlights: Factsheet 2 Ontario Ministry of Finance Proportion of foreign-born and visible minority populations by census metropolitan area, 2006 and 2031 (reference scenario) Statistics Canada Projections of the Diversity of the Canadian Population, 2006 to 2031 Statistics Canada
0 Comments
Your comment will be posted after it is approved.
Leave a Reply. |